In September, demand for freight continued to remain strong. However a combination of tighter capacity and fuel price increases were causes for higher spot market rates. Refrigeration and flatbed freight dropped from August to September according to DAT Truckload Freight Volume Index. The index reflects changes in the actual number of spot market loads moved each month.
“Truckload volume has been strong all year long, but pricing hasn’t always kept pace,” explained Peggy Dorf, market analyst with DAT Solutions. “That’s because truckload rates are tied more closely to capacity than volume, and last month a number of events limited truck availability in key markets for shippers and freight brokers.”
In early September, supply chains were disrupted because of Hurricane Dorian., During this time, the spot market kicked in for resupply and recovery along the Southeast coast. Flooding in the Gulf Coast from Tropical Storm Imelda caused delays in freight. As we moved from summer to fall, retail shipments increased causing a spike in freight demand towards the end of the month.
Fall harvesting shipments pushed reefer load counts 10 percent higher than September 2018 despite a 7.6 percent decrease from last month’s peak demand. Nationally, reefer rates averaged around $2.16 per mile in September, a $0.02 increase over August but a $0.35 drop from September 2018.
In 2019 flatbed markets have lagged, but spot prices began to stabilize during the month of September. The national average was $2.19 per mile, the same as August, which was $0.32 below the higher rates from September 2018. Flatbed volume declines 8.2 percent compared to August, but load counts remained 14 percent above where they were last year.
“The spot market gained a lot of momentum heading into Q4,” said Dorf. “We expect demand to remain elevated through the rest of the year.”
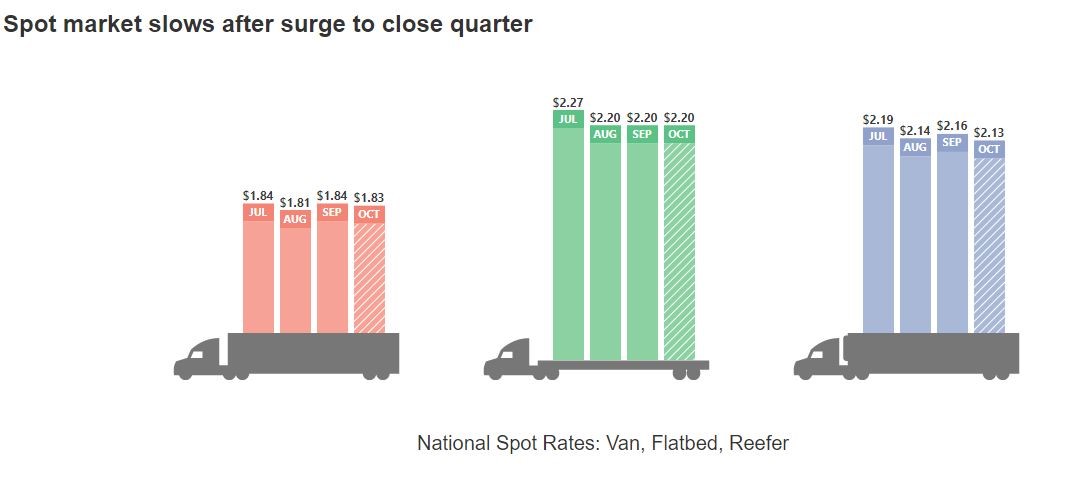
The first week of October was quieter within the spot market. Load-to-truck rations declined for vans, reefers and flatbeds, but national average rate for vans and flatbeds remained above the September averages.
The graph shows the national average spot market rates from the last four months.
Sources:
https://www.fleetowner.com/economics/fewer-trucks-meant-higher-rates-september